Copyright © 2022-2026 basebox GmbH, all rights reserved.
Licensed to be used in conjunction with basebox, only.
Licensed to be used in conjunction with basebox, only.
// admin
Dashboard
Brief description
The dashboard is your control center with the most important figures and activities for your organization.
What is the dashboard used for
The dashboard gives you a quick overview of usage, active apps, and costs – ideal for keeping usage and budget in view.
Where to find the dashboard
Open Administration → Dashboard in the sidebar. It is the home page of the administration area and is visible only to administrators.
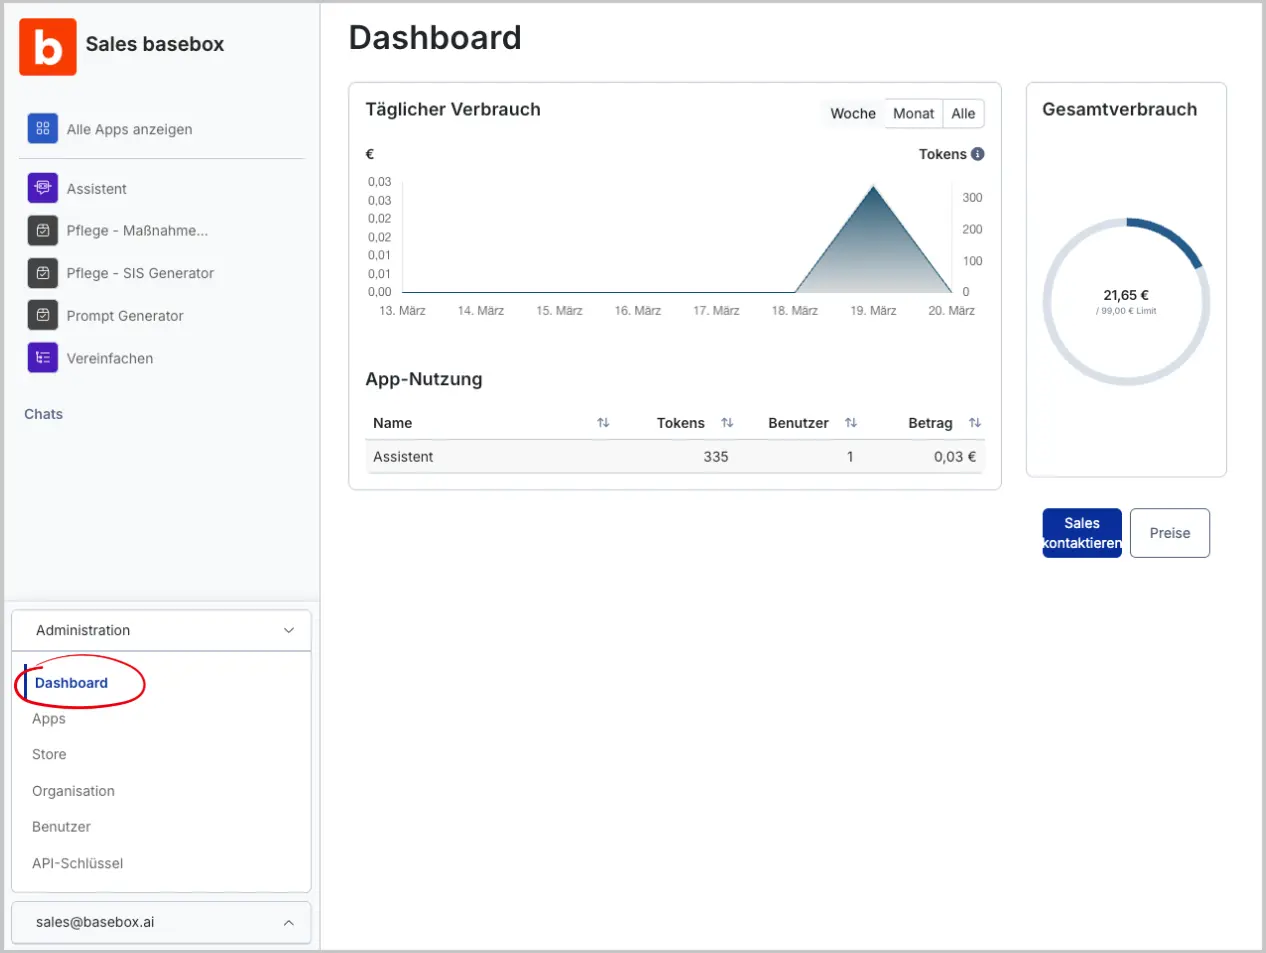
The dashboard is divided into three areas:
- Daily usage – a chart showing usage per day, displayed with two metrics: cost in euros (left axis) and tokens (right axis). Use the Week / Month / All toggle at the top right to select the time range.
- App usage – a table of your apps with the columns Name, Tokens, Users, and Amount. Use the arrows in the column headers to sort the table.
- Total usage – a ring showing total usage to date in euros relative to your limit. Below it you'll find the Contact sales and Pricing buttons.
Step by step
How to read and use the dashboard:
- Choose a time range – Toggle the "Daily usage" chart between Week, Month, and All.
- Read usage – Check costs (€) and tokens over time.
- Compare apps – Sort the "App usage" table by tokens, users, or amount to identify the most intensively used apps.
- Keep an eye on your budget – Check the "Total usage" ring to see how much of the limit has already been used.
Notes
Note
- The dashboard is purely informational – no settings are changed here.
- Tokens are the unit of AI usage; the amount in euros results from that usage.
- Usage of the OpenAI-compatible API is reported separately from the web interface.
- The About/Info page shows the active model, the context size, and whether speech recognition and the API are available.
- Only administrators have access to the dashboard.
Frequently asked questions
Who can see the dashboard? Only administrators of your organization.
What does "tokens" mean? Tokens are the unit in which AI usage is measured. The amount shown in euros is based on this usage.
Can I change the reporting period? Yes, via the Week / Month / All toggle in the "Daily usage" chart.